Updates, ideas, insights and tips from the ChartMill Team
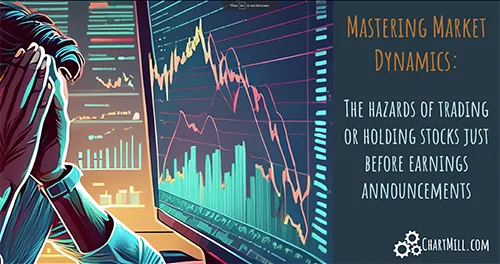
The hazards of trading or holding stocks just before earnings announcements
Are you one of the traders who - in anticipation of earnings announcements - anticipated a sharp rise but ended up being left dazed after the stock price opened more than 10% lower? If so, here are some practical tips to avoid this in the future.
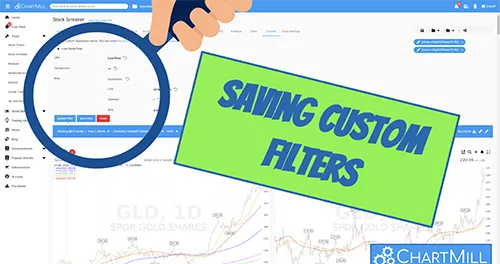
Update Stock Screener: Saving Custom Expressions
Custom Expressions are one of the most powerful applications in ChartMill and from now on you can save those custom filters separately so you can add them to any screen with just one click.
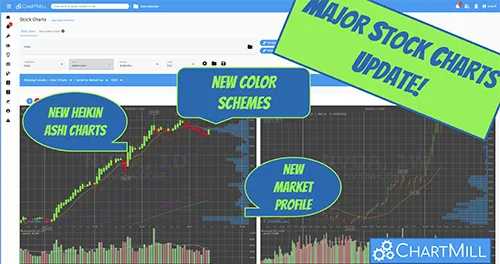
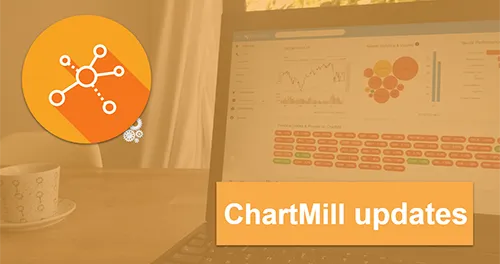
Major Stock Charts Update
New color schemes, indicators, overlays and much more....
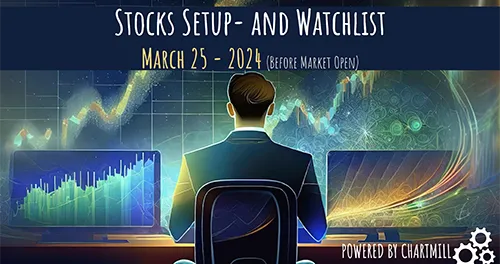
Weekly Watchlist and Setuplist
Setup- and watchlist before market opening. The screening is done based on last Friday's closing prices.
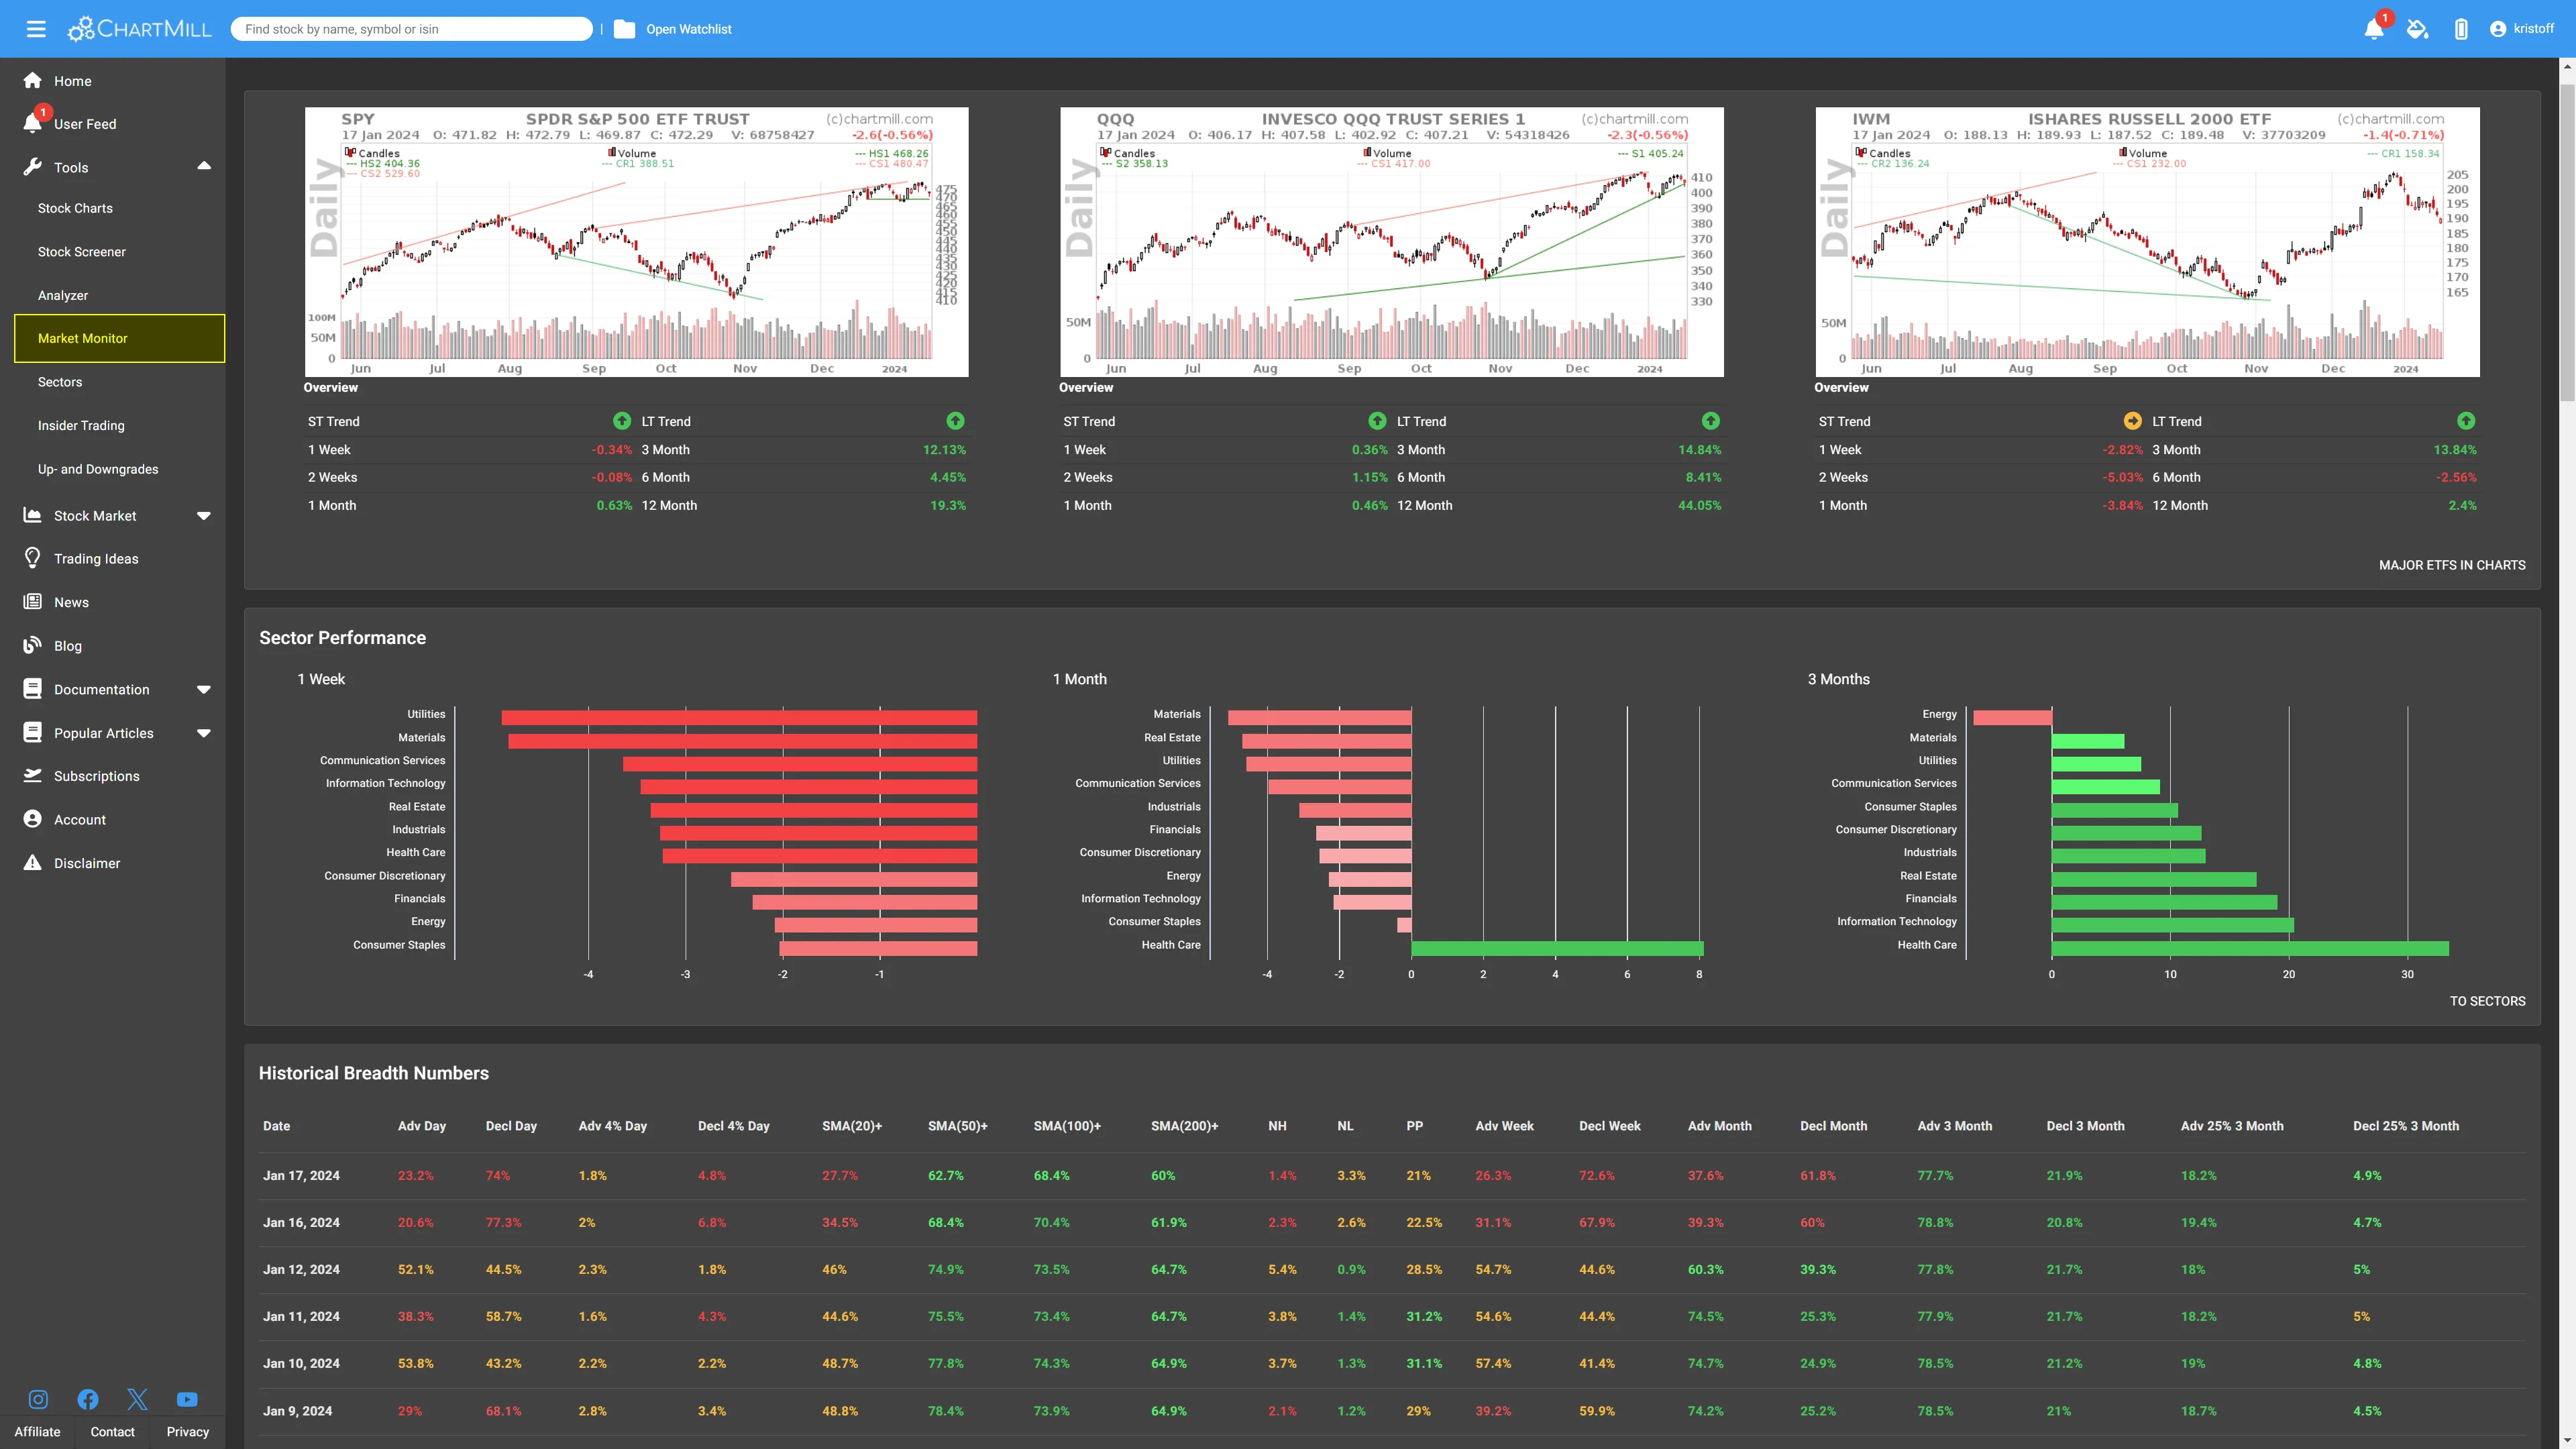
New Homepage and Market Monitor Feature added
New year, new look, new features!
New Long Setup 2023-11-30
New Long Setup for the Twitter Paper Trade Account
New Paper Trade Setup - Aercap Holdings
New long setup for the Minervini paper trading account

80% Gain in Seven Days With Minimal Risk: How I Find and Trade a Typical Minervini Breakout Setup.
This Minervini breakout setup is one that rolled out of one of my screens on Friday, November 3, 2023, after the stock market closed.

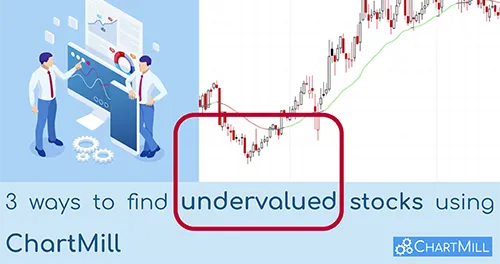
How To Find Undervalued Stocks Screener ChartMill
3 Ways To Find Undervalued Stocks Using The Stock Screener ChartMill

5 quality stocks getting ready to break out
5 stocks that meet specific quality criteria and whose price is about to break out above key resistance.

3 Fundamental Trading Ideas Added to the Screener
New fundamental screening filters available

Tesla Q1 Earnings 2023: What To Expect?
Get insights on Tesla's Q1 earnings 2023, expectations, and analyst ratings. Learn how price cuts affect profitability and market share in the EV industry.
ChartMill Stock Screener Update 2023-04-12
Create custom views to view screen results your way. Our recent update makes it easier with drag-and-drop features and adjustable predefined views. Learn more.
Six stocks ready to reverse
These shares are showing a reversal pattern at the level of the lower bollinger bands while price closed above those lower bollinger bands. In doing so, the buying volume was higher than the selling volume on the penultimate trading day.

Four basic screens to start your own investment portfolio.
Investors come in different styles and sizes. In this article we look at four different investment strategies that can serve as a basis for building your own investment portfolio. We explain what each style entails and what basic filters you can use in ChartMill to get a first basic selection.
Four US stocks on the verge of a breakout
These two stocks show noticeable rising buying volume just before an important resistance level. This may be a sign of an imminent price breakout.
These two stocks are poised to break out.
These two stocks show noticeable rising buying volume just before an important resistance level. This may be a sign of an imminent price breakout.

Analyst screening filters in ChartMill
In this article we will discuss the information you can find under the analysts tab and how you can use these filters when screening stocks.
Two US stocks ready to breakout
Two U.S. stocks that, based on their most recent closing price, are very close to key resistance levels and show higher buying volume.
Top breakout stocks on higher volume
A listing of stocks that, based on their most recent closing price, have broken out above a key resistance level with increased volume. These stocks are ideal momentum plays for swing and day traders.

Maximize Your Returns with These 6 Tips for Finding Dividend Growth Stocks
Discover strategies to find dividend growth stocks and maximize your returns. Learn about the importance of evaluating factors such as a strong cash position, earnings growth and payout ratio, and how to use these tips to select the right dividend growth stocks.
New major updates to our stock screener | additional and expanded estimates, extra dividend filters and more display options!
Once again we have some new and pretty useful features and updates to announce that will make your favorite stock screener even more user-friendly and efficient.

The January effect: Understanding the phenomenon in the stock market
The January effect is a well-known stock market phenomenon that refers to the tendency of stock prices to rise at the beginning of the year. The effect is said to have the most impact on small-cap stocks because of their lower liquidity. The reason for this seasonal rise in stock prices is often attributed to a combination of factors that we will explain in this article.

Much higher subscriber growth for streaming giant Netflix
Netflix surprised with much larger subscriber growth than expected and forecasts revenue growth of 4% for the first quarter 2023

Are tech stocks bottoming out?
2022 was a grim year for many investors. Especially technology stocks, which are seen as typical growth stocks, saw a lot of their market value disappear. The reason is obvious. Skyrocketing inflation and the Fed systematically raising interest rates in an attempt to dampen that same inflation.
ChartMill introduces Industry and Sector Rankings!
We have added industry and sector rankings for many fundamental ratios, both in the views and in the screener.

TIMKEN | Technical buying opportunity in one of America's most responsible companies
The stock screener identified a technical buying opportunity which can be particularly interesting for swing traders. In this article, we explain exactly what that means while looking at a number of fundamental parameters regarding valuation, profitability, growth and financial health of the company to see if Timken could be a good candidate for the more fundamental investor as well.
ChartMill stock screener updates
New Features and Updates in the Stock Screener

3 Breakout Swing Trading Ideas Before Market Opening
3 technical breakout swing trading setups that you should keep an eye on when market sentiment remains positive.

2 new quality investing trading ideas added
The Caviar Cruise screen is a screen dedicated to Quality Investing. While both Caviar and Cruises are associated with richness and wealth, we mainly used this name to pay tribute to a Belgian author Luc Kroeze, who’s book (The Caviar Formula) was used as inspiration for this screen.

US Market Update DIA QQQ IWM SPY
The latest news on the U.S. equity markets with technical updates for the major indices DIA QQQ IWM SPY
4 new dividend trading ideas added
We recently added four brand new trading ideas for the dividend investor. Check them out!

US Market Update DIA QQQ IWM SPY
Big tech stocks went down heavily and the price of oil is at its lowest level since January 2022.... Fear of recession is omnipresent and weekly losses for major US index ETFs ranged from -4% (dow jones) to -6.4% (Russel 2000).

Some mean reversion swing tradings ideas before market opening
After yesterday's extremely red stock market day, we noticed that ChartMill spotted quite a few stocks that previously showed an upward breakout but fell back below their breakout levels after yesterday's session.
ChartMill stock screener updates
Some minor updates added to the stock screener

US Market Update DIA QQQ IWM SPY
The latest news on the U.S. equity markets with technical updates for the major indices DIA QQQ IWM SPY

LIGHTWAVE LOGIC INC. (NASDAQ: LWLG) Breakout Swing Trading Momentum Idea
Lightwave Logic, Inc. is a development stage company which engages in the commercialization of electro-optic photonic devices.

GILEAD SCIENCES (NASDAQ: GILD) Breakout Swing Trading Idea
Gilead Sciences, Inc. is a biopharmaceutical company, which engages in the research, development, and commercialization of medicines in areas of unmet medical need.

Finding the strongest stocks using Relative Strength
Those who invest are obviously looking for returns, as much and as quickly as possible.... So you want to buy the ones that perform best, outperforming their sector peers or the market in general. Relative strength is a great measuring tool to find such stocks.

WINNEBAGO INDUSTRIES (NYSE:WGO) Breakout Swing Trading Idea
Winnebago Industries, Inc. engages in the design, development, manufacture, and sale of motorized and towable recreation products.

SIERRA WIRELESS INC. (NASDAQ:SWIR) momentum breakout alert!
Sierra Wireless, Inc. engages in the provision of device-to-cloud and networking solutions.

AMERICOLD REALTY TRUST INC. (NYSE:COLD) momentum breakout alert!
Americold is a real estate investment trust, which focuses on the ownership, operation, development, and acquisition of temperature-controlled warehouses.

US Market Update
Substantial weekly losses for the US ETF indices. Particularly last Thursday and Friday saw heavy losses. The reason is obvious, an ever-increasing consumer price index for the month of May.

US Market Update
The major US indices enjoyed a strong week. Best performer in the class was the technology-heavy Nasdaq which ended the week with a gain of more than 7% (QQQ index ETF). The bear is licking its wounds....

US Market Update
"A Bipolar disorder is a disorder that involves episodes of mood swings, ranging from depressive lows to manic highs"*. For those who have trouble imagining this, we recommend taking a look back at the financial markets last Wednesday and Thursday.
US Market Update
One glimpse at the weekly charts of the main US stock market indices says it all. The least you can say is that 2022 has started off in a bad way. The S&P500 lost almost 6% on a weekly basis.

US Market Update
The financial markets are jittery, volatility is at an all-time high, and the major stock market ETF-indexes ended lower this week.
US Market Update
Black Friday 2021 will be one to remember and not just because of the exceptional deals that day.... No, this Black Friday will be remembered among investors mainly as the worst trading day for the Dow Jones so far for the year 2021, with a loss of 2.5%. The previous "record" dates back to July 19 when the DOW closed 2.1% lower.
US Market Update
We have witnessed a very powerful market rally worldwide over the past few weeks. For the US market, it is the QQQ in particular that stands out. This ETF recently touched the $400 mark for the first time, setting yet another all-time high.
US Market Update
Our last general market update dates from just a month ago. Meanwhile, we are October 17, 2021, the first results of the third quarter are known. It was mainly a number of financial companies that announced their results. And they all performed much better than expected...
US Market Update
Since the beginning of September, we have seen predominantly red trading days on the charts of the major US indices. But does this mean that we are at the beginning of a new long-term downtrend or is this yet another dip in the long-term uptrend? Who will tell?